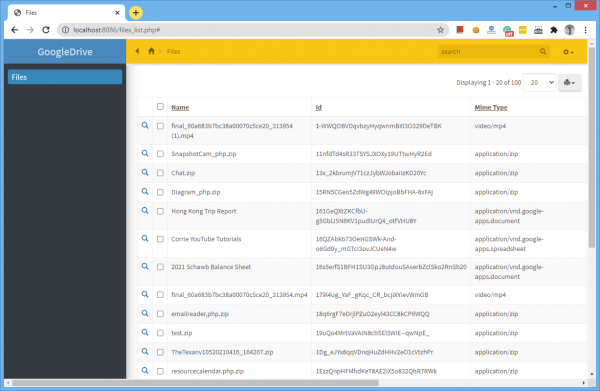
In this article, we’ll show you how to retrieve a list of files from Google Drive via REST API and display those files in your PHPRunner or ASPRunner.NET application. This is how it looks in the generated application. The list of files is retrieved from Google Drive and displayed in your own application. In this test app, we only implemented search and view functionality, but adding and deleting files can be done as well.
Continue Reading "Working with Google Drive REST API"Some web applications need to provide quick access to certain pages or documents. For instance, you can share a file via such a link or send a link to an invoice to be paid to your customer like the one on the screenshot below. Let’s see how you can implement this kind of link in your own project. The key is to create add a new text field to the table with invoices or documents that will store a long unique record identifier which will…Continue Reading “Providing access to web application via unique link”
PHPRunner and ASPRunner.NET v10.6 are here!
If you purchased PHPRunner or ASPRunner.NET less than one year ago you can logon to the control panel and download the registered version of the software there.
What’s new in this version
1. New security providers in version 10.6
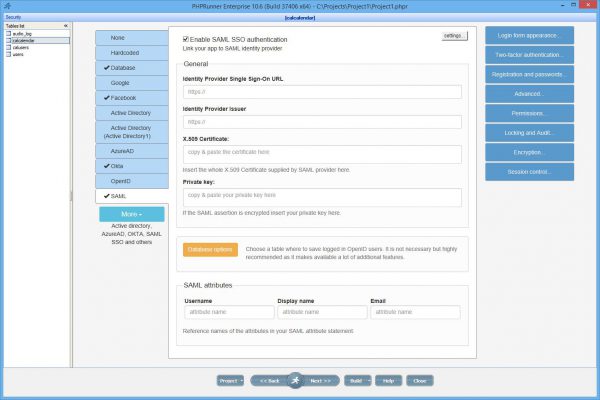
New security providers: Azure AD, OKTA, SAML, OpenID. An option to combine multiple security providers i.e. you can use Active Directory together with database-based security.
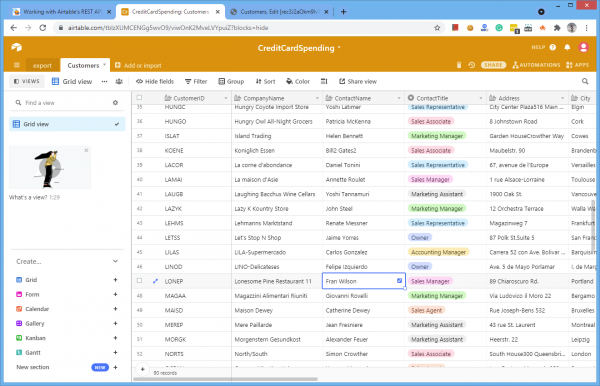
Continue Reading "Version 10.6"Airtable is a very popular and easy-to-use “cloud database”. It is basically an online spreadsheet on the web that provides tons of integrations with other services. While most web developers prefer to use a real database as a backend of their web application your clients may appreciate it if you can also pull data from their AirTable’s spreadsheet.
Continue Reading "Working with Airtable’s REST API"Low-code software builders will take off your hands most boring and repetitive tasks, which includes the security of your web application. Apps, created by PHPRunner and ASPRunner.NET follow all the security standards and secure out of the box. Your projects will be protected from SQL injection, XSS, CSRF, and more. If you’d like to know more about the most common web application vulnerabilities check OWASP Top Ten Security Risks. In this article, we will discuss additional security measures that are not directly related to the generated code but nevertheless are extremely important. If you ever need to build a public web application you need to go through this checklist and make sure your application complies.
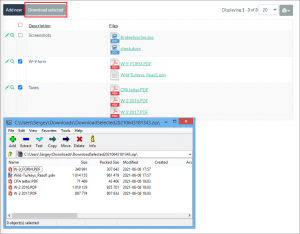
Continue Reading "Building secure low-code web applications"This tutorial covers a simple but common need. You have a page with a list of files and want your users to select and download multiple files at once. In this example, we will use the upload field that can store multiple files at once.
Continue Reading "Zip and download selected files"Quite a few people asked how to extend Dialog API by adding dropdown boxes populated by the database content. Since Dialog API is Javascript based there will be a little trick that would help us retrieve the data from the database on the server-side and pass it to Javascript.
Continue Reading "Database-based dropdowns with Dialog API"Enterprise Edition of PHPRunner and ASPRunner.NET provides Active Directory authentication option. It is a useful feature but it has some restrictions, for instance, you cannot use a hybrid database/AD approach where some users will use Active Directory login and some others will have their usernames and passwords stored in the database.
This changes in version 10.6 where Active Directory is no longer a replacement for database-based login but a supplement. Active Directory is now considered a “security provider” and works the same way as “Login via Google” or “Login via Facebook”. We are also adding new security providers like OpenID, SAML, AzureAD and Okta.
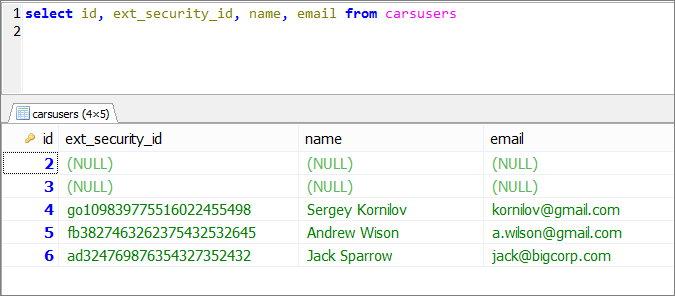
This is how it works on the backend side. If you have used “Login via Google” or “Login via Facebook”, you should be already familiar with this concept. When user logs in via a third-party security provider we create a record in the users table with a unique id that for Facebook starts with fb, for Google it starts with go, and for Active Directory that prefix will be ad.
Continue Reading "New security providers in version 10.6"As web developers, we deal with large amounts of data every day. Sometimes it helps to sit back and take a closer look at the data in hand and see what data is trying to tell.
Here, at Xlinesoft.com customer support is one of the most important parts of the business. We deal with a large number of emails and helpdesk tickets every day and, as a small weekend project, we decided to build a few charts to analyze those emails. We are sharing these results here and hoping that it can provide you or your clients with some insights.
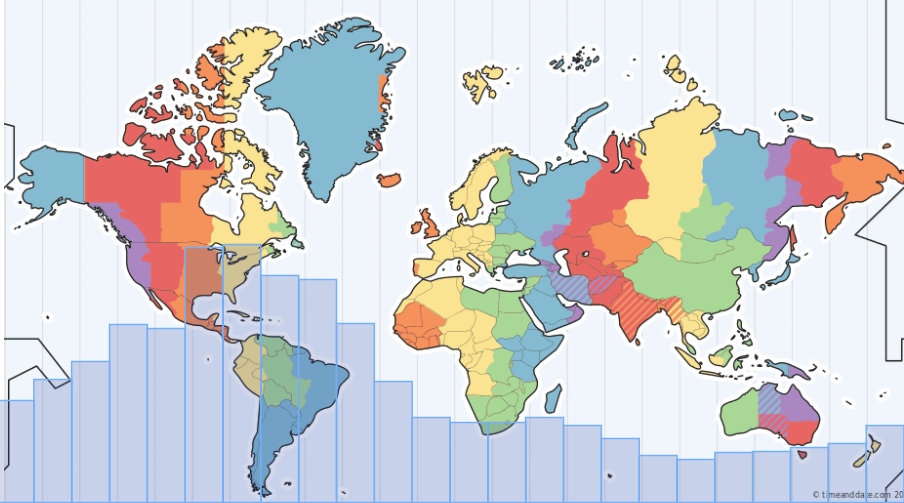
First of all, we analyzed incoming support requests by the hour of the day. There is no surprise that 9am to 1pm US Eastern time is the busiest time of them all as emails from Europe and tickets from both East and West coast are coming in. We grouped those emails by the hour of the day and placed them on the world map with timezones for easy digesting.
Continue Reading "Analyzing incoming emails"Version 10.5 of PHPRunner, ASPRunner.NET and ASPRunnerPro is here!
What’s new in this version
1. Reports editing in Page Designer
Continue Reading "Version 10.5"