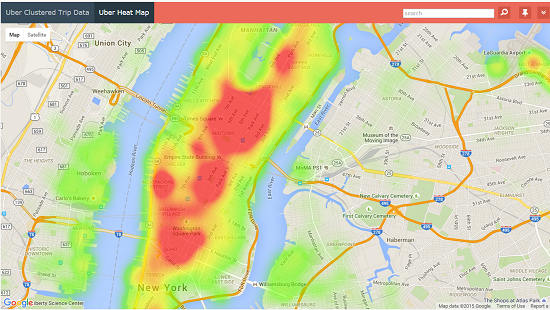
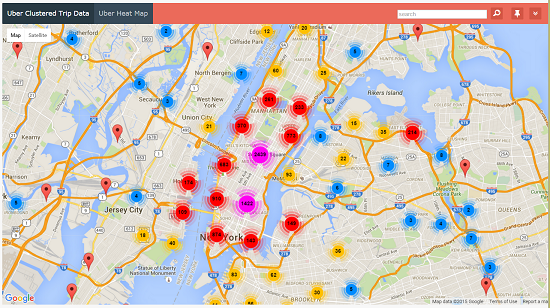
The latest version of Runner family products comes with several improvements in mapping area like support of Bing and OpenStreet maps, maps in dashboards, custom map markers etc. In this article I want to show a couple more mapping features that you can use in your apps, heat maps and clustered maps.
Both those features can help you visualize large amounts of mapping data. It gives your users a better insight on your data. For instance, those maps tell you that if you are a taxi driver in NYC, your chances to pickup a passenger are higher if you are nearby Trump Tower.
There are some limitations that you need to bear in mind:
- This functionality only works with Google maps
- This functionality only works with lat/lon pairs as opposed to addresses
- This will only work with map added to the List page via ‘Insert map’ function (won’t work in dashboard)
- Heat maps and clustered maps will always use all the data returned by query (as opposed to only data from the current page)
These are sample pages built-in of anonymized Uber taxi service trip data. This app uses 10,000 passenger pickup data points collected in New York City (a full dataset if you need it). Click on image to see the live app.
Heat map
Clustered map
Code
Insert a map into any list page that has lat/lon values and modify the code adding the following line at the end of map code.
PHP
// Clustering
$mapSettings['clustering'] = true;
// Heat map
$mapSettings['heatMap'] = true;
ASP
' Clustering
mapSettings("clustering") = true
' Heat map
mapSettings("heatMap") = true
C#
// Clustering
mapSettings["clustering"]=true;
// Heat map
mapSettings["heatMap"]=true;


Brilliant and seamless. This is why I love ASPRunner!!!!
Great! I just needed that thing