PHPRunner and ASPRunner.NET dashboards can display several grids on one page. In this tutorial, we will add a separate search box to each grid so users can filter Customers, Products, or Employees without affecting the other dashboard elements.
The solution uses one reusable JavaScript function and a small amount of Custom CSS. The same code works in PHPRunner and ASPRunner.NET.
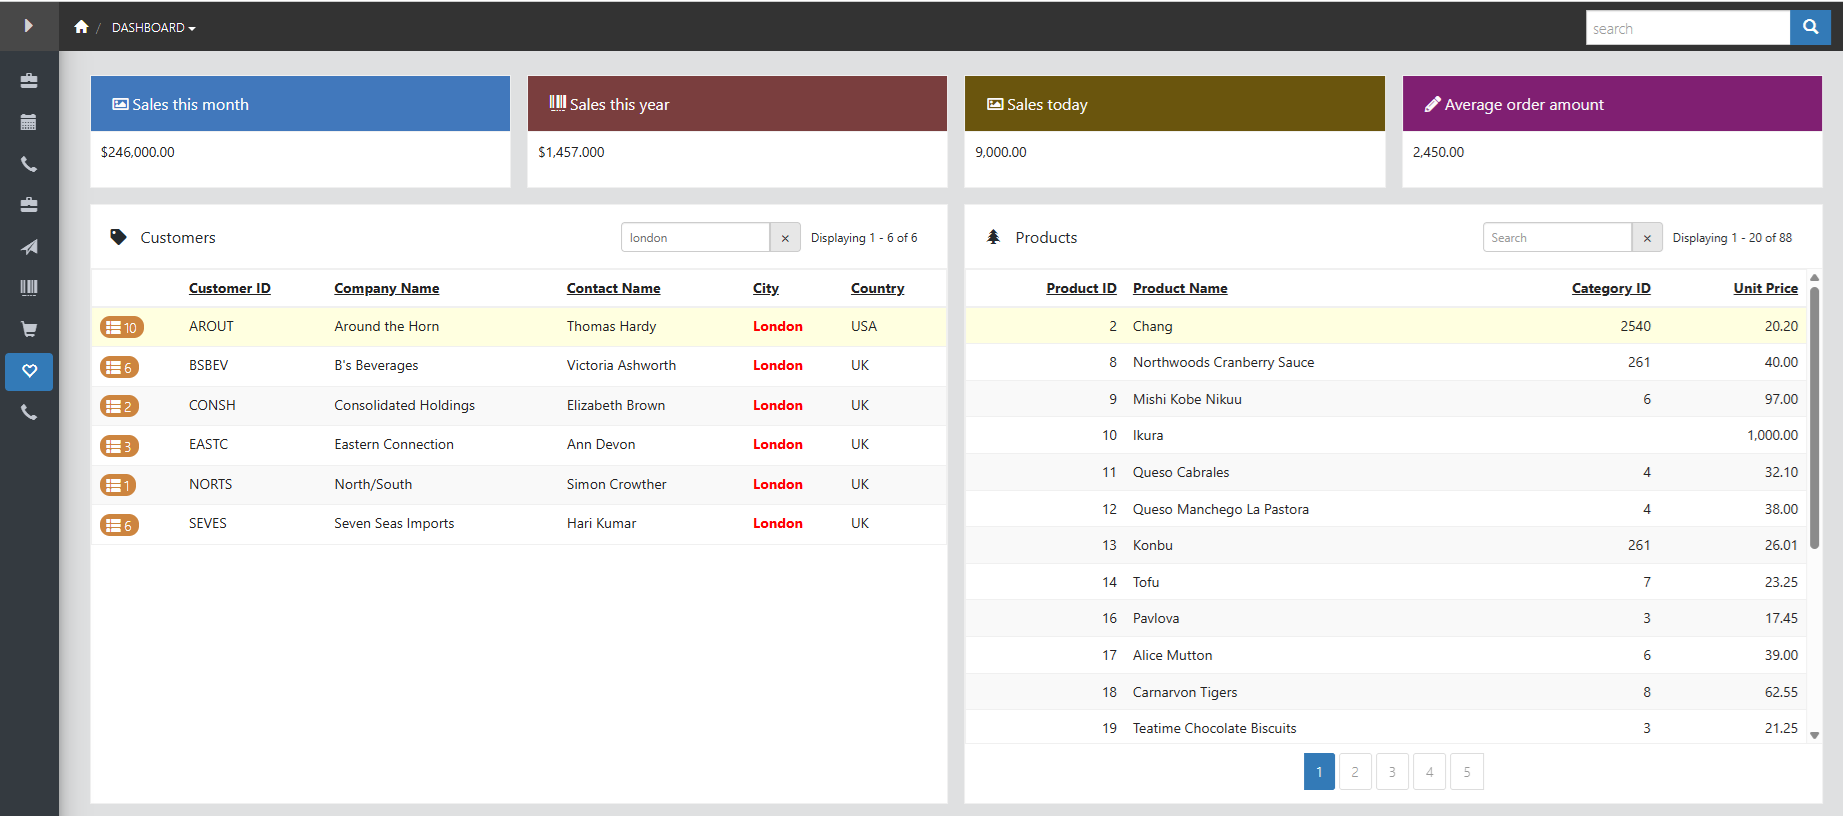
1. Preparing the dashboard
Create a dashboard and add the grid elements that need their own search boxes. This example uses the customers, products, and employees data sources.
You will pass these data source names to the search function in section 3. Use the names as they appear in your project, not the visible dashboard panel captions.
2. Adding the dashboard grid search function
Open Events → custom_function.js and add the following JavaScript:
The function finds one dashboard element by its data source name and adds a search control to that element’s panel heading. Pressing Enter passes the search phrase in qs and reloads only that grid. The clear button removes the stored search.
Dashboard grids replace their markup after an AJAX refresh. The MutationObserver restores the search box after that replacement while preserving the current search phrase.
3. Enabling search for the required grids
Open Events → Dashboard → Dashboard page → JavaScript OnLoad and call the function once for each grid:
Replace these values with the data source names used by your dashboard. Omit any dashboard element that should not have an individual search box.
4. Styling the search boxes
Open Style Editor, click ‘Modify CSS’, and add the following code:
The desktop layout places the search box beside the record counter. Below 900 pixels, it moves to a separate line so the panel heading remains usable on smaller screens.
After rebuilding the project, open the Dashboard page and enter a phrase in one of the search boxes. Press Enter and confirm that only the corresponding grid is filtered. Click the clear button to restore the full grid, then repeat the test after collapsing and expanding the dashboard panel.
