In PHPRunner 9, ASPRunner.NET 9.0 and ASPRunnerPro 9.5 we are switching to new version of charting components: AnyChart 7. What does this mean for you as a user?
- AnyChart 7 is Javascript based. No more Flash charts, works out of the box on all devices
- AnyChart 7 provides better user experience, more functionality, better looking charts
- We are adding ChartModify event that would allow you to tweak charts appearance and behaviour in endless ways. You can copy and paste basically any example from AnyChart manual as is.
Below are a few examples of how you can use ChartModify event.
Add horizontal scroller
var currentScroller = chart.xScroller();
currentScroller.enabled(true);
Add horizontal scroller and set initial zoom to 50%
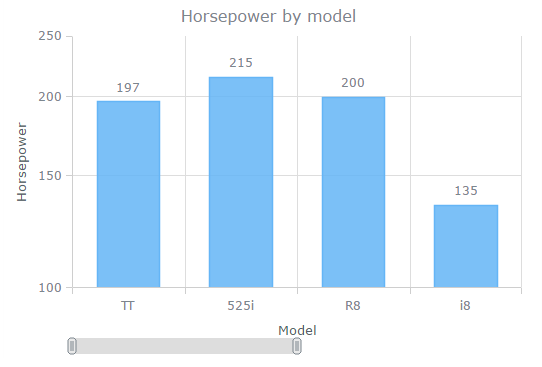
var zoom = chart.xZoom();
zoom.setTo(0, 0.5);

var currentScroller = chart.xScroller();
currentScroller.enabled(true);
Change labels color and font size
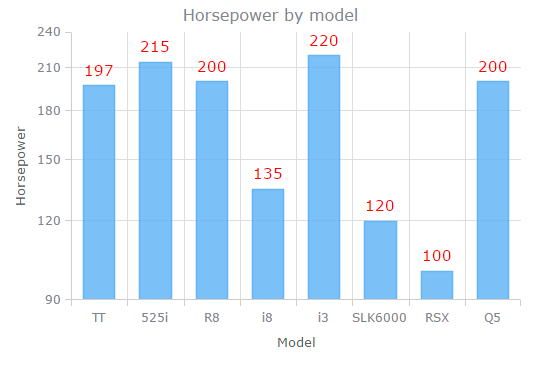
Using separate API calls to set series color and font size:
// Gets series by index, 0 - first series, 1 -second series etc
var series = chart.getSeriesAt(0);
series.labels(true);
series.labels().fontSize(15);
series.labels().fontColor("#ff0000");
Setting several labels parameters in one go:
// Gets series by index, 0 - first series, 1 -second series etc
var series = chart.getSeriesAt(0);
series.labels(true);
series.labels.{fontSize: 15, fontColor: "#ff0000"});
More info on modifying labels appearance
Series appearance
Single color:
// Gets series by index, 0 - first series, 1 -second series etc
var series = chart.getSeriesAt(0);
series.color("#FF0000", 0.25);
Gradient fill:
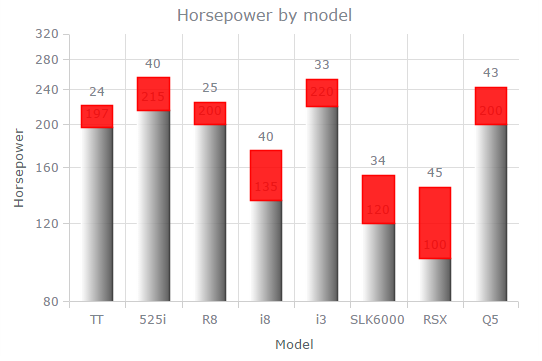
// Gets series by index, 0 - first series, 1 -second series etc
var series = chart.getSeriesAt(0);
series.color(["#FEFEFE", "#424242"], 0.69, 0.59);
More info on changing series colors
Customize chart title
Change title color:
chart.title().fontColor("#FF0000");
Change title and color:
chart.title({text: "Custom title", fontColor: "#F44336"});
Disable title:
chart.title(false);
More about title customization
Values formatting
Formatting values as currency. You can use any Javascript code to format values.
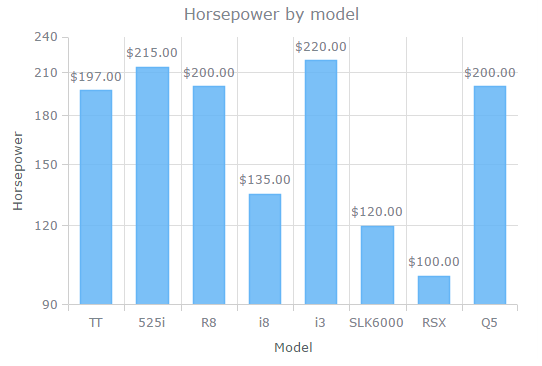
var series = chart.getSeriesAt(0);
series.labels().textFormatter(function(){
        var num = Number(this.value);
	return(("$"+num.toFixed(2)));
});
Multiple Y-axis
Here is how to add an extra Y-axis on the right ranging from 100 to 500 with ticks after each 25 points:
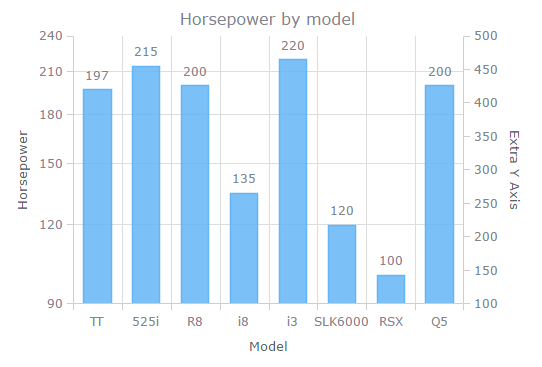
  var extraYScale = anychart.scales.linear();
  extraYScale.minimum(100);
  extraYScale.maximum(500);
  var extraTicks = extraYScale.ticks();
  extraTicks.interval(25);

  // Create and tune additional y axis
  var extraYAxis = chart.yAxis(1);
  extraYAxis.orientation("right");
  extraYAxis.scale(extraYScale);
  extraYAxis.title("Extra Y Axis");
Passing data to chart from server side
We can use a technique here similar to what we use in Javascript OnLoad event.
1. In BeforeDisplay event we pass some data to Javascript event via proxy object
2. We use this proxy object in ChartModify event
BeforeDisplay event, PHP:
$pageObject->setProxyValue("name", $_SESSION["UserID"]);
BeforeDisplay event, ASP:
pageObject.setProxyValue "name", SESSION("UserID")
BeforeDisplay event, C#:
pageObject.setProxyValue("name", XSession.Session["UserID"]);
ChartModify event:
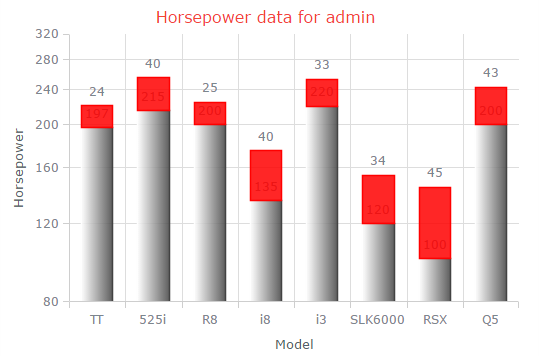
chart.title({text: "Horsepower data for "+proxy.username, fontColor: "#F44336"});
And this is what we get as a result. Current user name is displayed as a part of chart title.
Hello.
How can i order AnyChart 7 if a have php runner 9?
AnyChart 7 is already included in PHPRunner 9. Nothing special to do.