Building dynamic database charts with PHPRunner
PHPRunner lets you create database-driven charts directly from your application data. You can build line, pie, doughnut, horizontal and vertical bar charts, 3D charts, and other chart types, customize their appearance, and include them in your web applications.
Charts can be customized in PHPRunner and added to other application pages, including reports, list pages, and dashboards. You can also combine multiple charts with grids, reports, and other elements to build interactive dashboards.
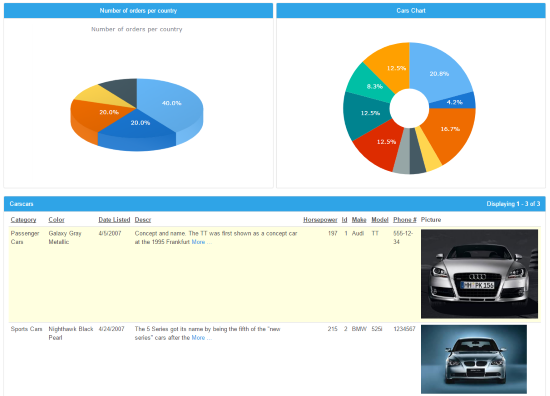
Chart values are typically based on numeric fields, but aggregate functions such as SUM, COUNT, MIN, MAX, and AVERAGE let you create charts from virtually any database data.
Consider the following Orders table:
| Customer | Country | Total |
|---|---|---|
| Andrew Peters | USA | $250 |
| Katie Bradshow | Australia | $85 |
| Jeff Simpson | USA | $150 |
| Arnold Matteus | Germany | $120 |
| Arnold Matteus | Germany | $160 |
| Jeff Montgomery | GB | $150 |
| Andrew Peters | USA | $65 |
| Jeff Simpson | USA | $95 |
| Luke Sohu | France | $40 |
| Jeff Montgomery | GB | $120 |
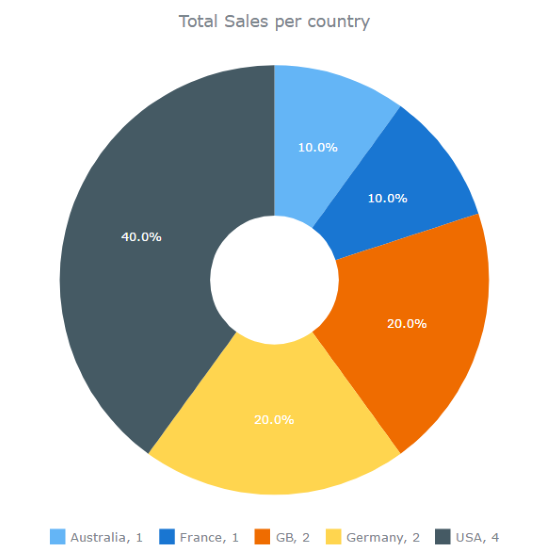
Example 1: Total sales per country
This query produces the following results:
| Country | Stotal |
|---|---|
| USA | $560 |
| Germany | $280 |
| GB | $270 |
| Australia | $85 |
| France | $40 |
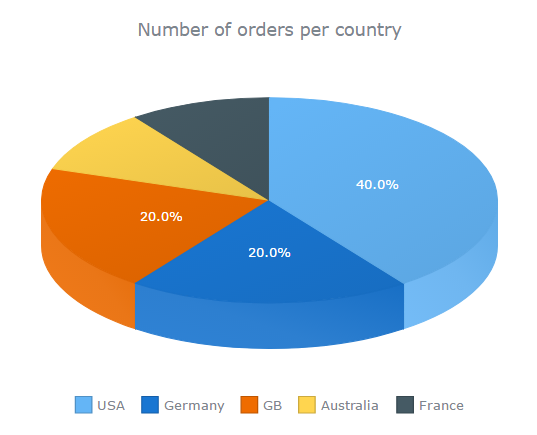
Example 2: Number of orders per country
This query produces the following results:
| Country | Ctotal |
|---|---|
| USA | 4 |
| Germany | 2 |
| GB | 2 |
| Australia | 1 |
| France | 1 |
Build charts and dashboards from your own database with PHPRunner. Try PHPRunner free.