Description
A Line chart displays information as a series of data points connected by line segments. The Line chart is often used to visualize a trend over of time.
With Line charts, the category data is distributed evenly along the horizontal axis, and the value data is distributed evenly along the vertical axis.
You can create single-series or multi-series Line charts.
Chart settings
•Line style - this option defines the line segments style (normal, spline, step).
Examples
Sample data table:
Month |
Sales2004 |
Sales2005 |
Jan |
10000 |
14000 |
Feb |
14000 |
15000 |
Mar |
12000 |
9000 |
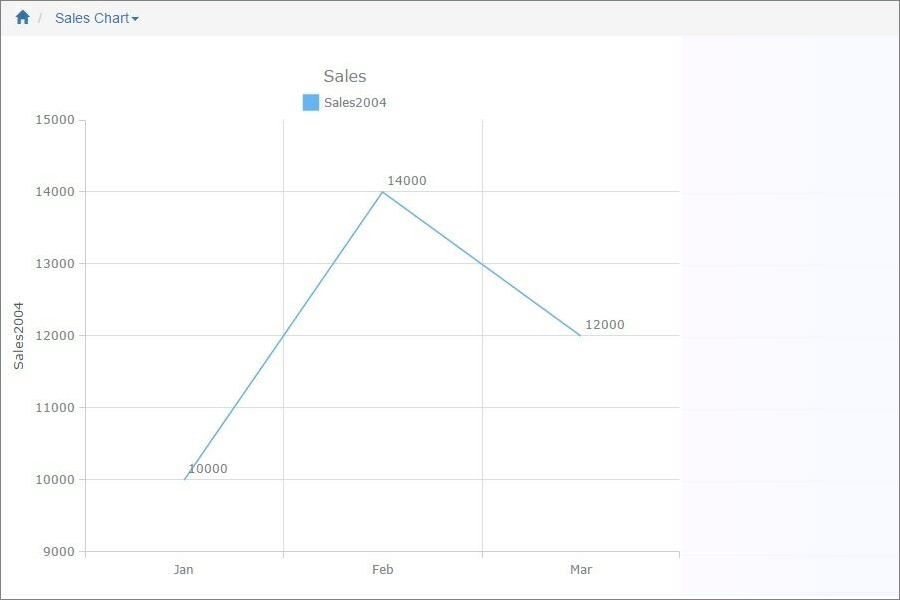
Single series normal chart
In this example, we chose Sales2004 as the Data Series field, Month as the Label field.
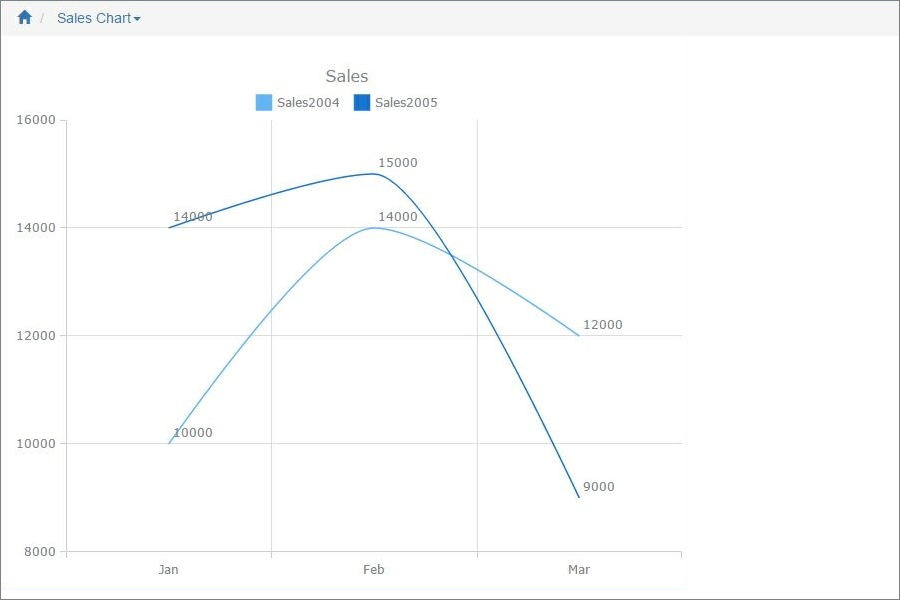
Multi-series spline chart
In this example, we chose Sales2004 and Sales2005 as the Data Series fields, Month as the Label field.
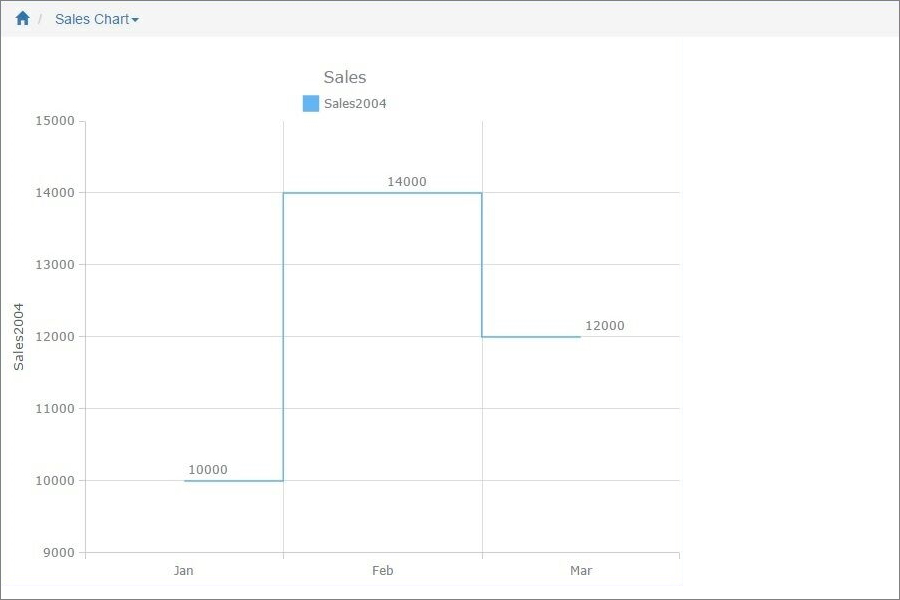
Single series step chart
In this example, we chose Sales2004 as the Data Series field, Month as the Label field.
Other chart types:
•Financial OHLC/Candlestick charts
See also:
•Using SQL to shape chart data