Description
A Combined chart allows you to combine several types of charts.
If you select one Data series field, you get a Line chart. If you select two Data series fields, you get a Line-Area chart. With three or more Data series fields selected - a Line-Area-Column chart.
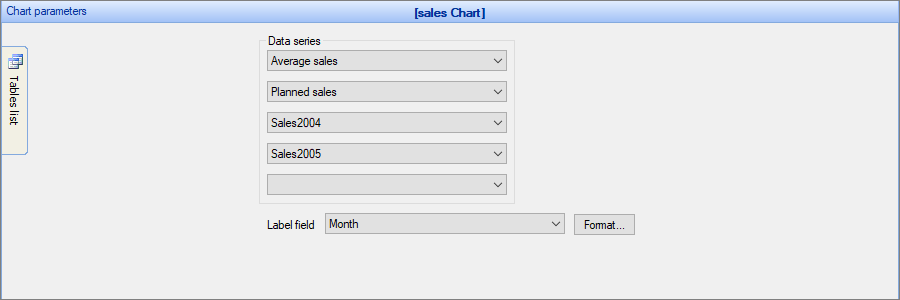
Examples of combined charts
Sample data table:
Month |
Average sales |
Planned sales |
Sales2004 |
Sales2005 |
Jan |
12000 |
13000 |
10000 |
14000 |
Feb |
14500 |
15000 |
14000 |
15000 |
Mar |
10500 |
14000 |
12000 |
9000 |
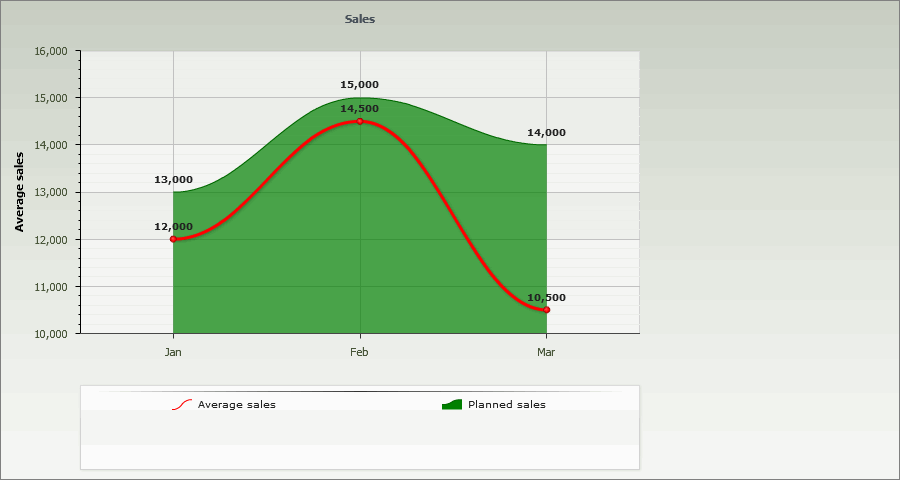
Example 1
In this example, we chose Average sales and Planned sales as the Data Series fields, Month as the Label field.
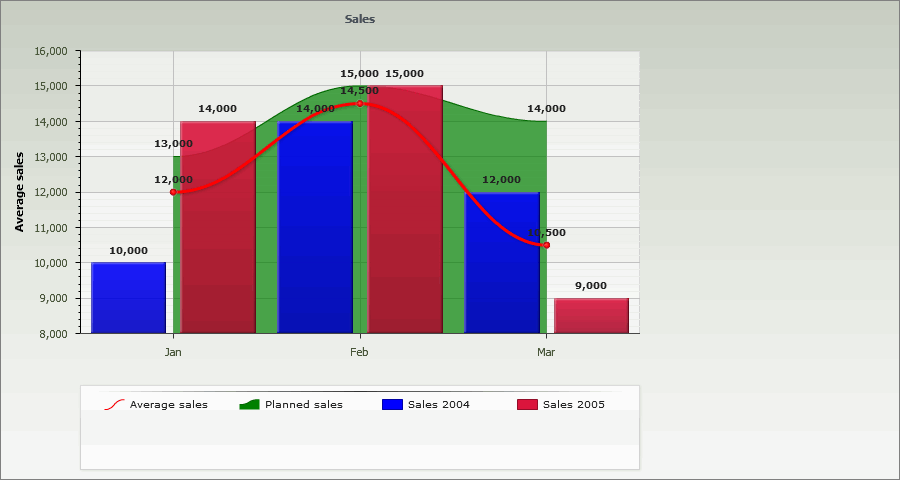
Example 2
In this example, we chose Average sales, Planned sales, Sales2004 and Sales2005 as the Data Series fields, Month as the Label field.
Other chart types:
•Financial OHLC/Candlestick charts
See also:
•Using SQL to shape chart data