Description
A Bubble chart is a variation of a Scatter chart in which the data pointers are replaced with bubbles. The Bubble charts are often used to present financial data. Use the Bubble chart when you want to emphasize specific values.
The Bubble chart needs 3 values: x, y and size. Depending on the data model and visualization purpose, the bubble chart may contain single series or multi-series data fields.
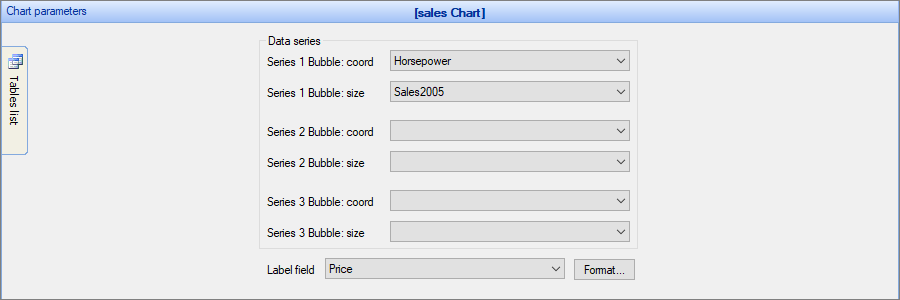
Chart settings
•Chart 3D - this option allows building a 3D (three-dimensional) chart. With this option is disabled, a 2D (two-dimensional) chart is built.
Examples
Example 1
Sample data table:
Make |
Horsepower |
Sales2005 |
Price |
Audi |
109 |
120000 |
17599 |
BMW |
146 |
109500 |
88999 |
Volvo |
122 |
130000 |
47899 |
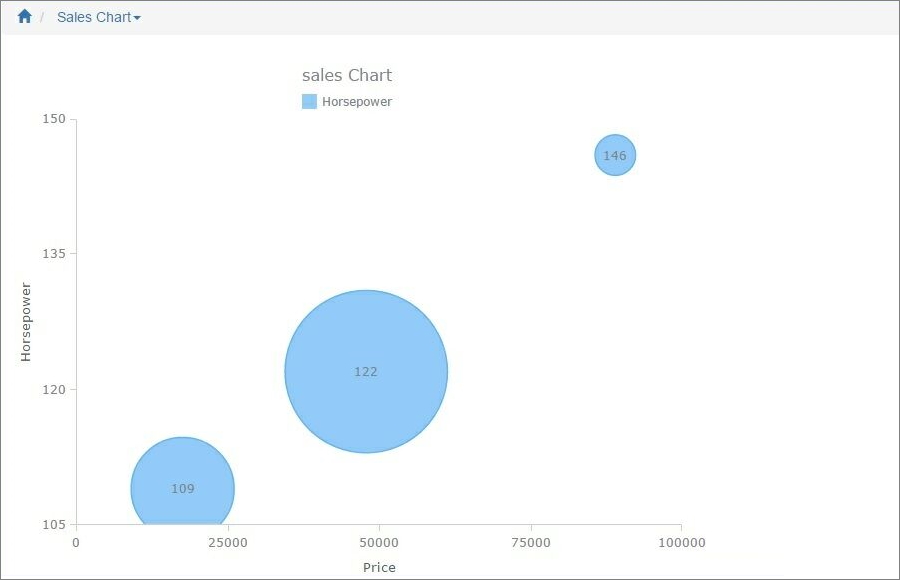
In this example, we chose Horsepower as the Y-axis field, Sales2005 as the Bubble size field, Price as the Label field (X-axis field).
Example 2
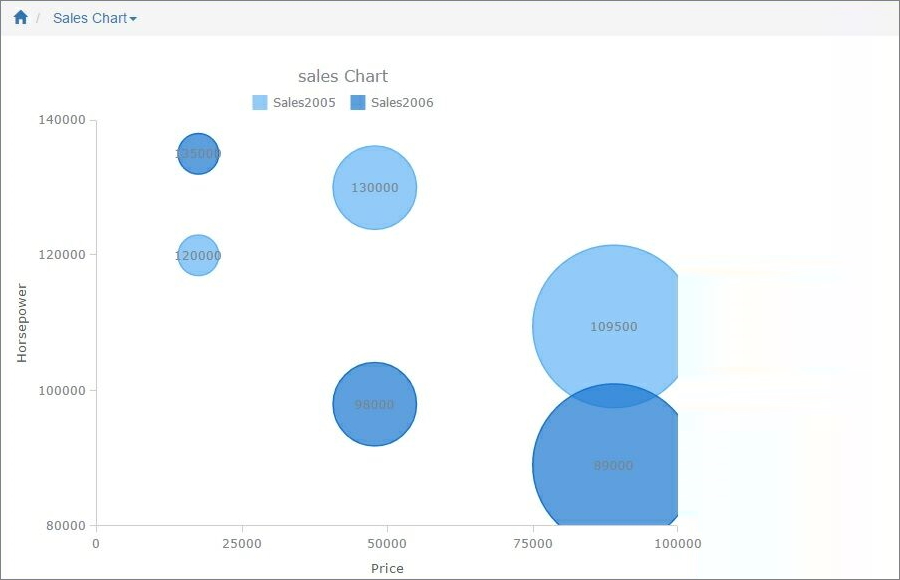
Here is an example of a chart with two data series selected.
Sample data table:
Make |
Horsepower |
Sales2005 |
Sales2006 |
Price |
|---|---|---|---|---|
Audi |
109 |
120000 |
135000 |
17599 |
BMW |
146 |
109500 |
89000 |
88999 |
Volvo |
122 |
130000 |
98000 |
47899 |
In this example, we chose Sales2005 and Sales2006 as Y-axis fields, Horsepower as the Bubble size field, Price as the Label field (X-axis field).
Other chart types:
•Financial OHLC/Candlestick charts
See also:
•Using SQL to shape chart data