Quick jump |
With master-details dashboards, the data you select in the master table filters the records in the details table. Make sure you have a master-details relationship between two or more tables before creating a master-details dashboard.
There are two ways to organize your master-details dashboard:
•Add a master table to the dashboard twice: as a data grid and then as details. This way, if the master table has several details tables, you can display all the details tables (each on a separate tab) or select the tables to display.
•Add a master table and a details table as data grids and enable the Filter by master table option for the details table. Use this option to display nested master-details tables, such as Customers-Orders-Order details. You can also display the master-details relationship between other elements, for example, between a table and a map.
Master table as a data grid and as details
1. Add a master table to the dashboard as a data grid and then once again - as details.
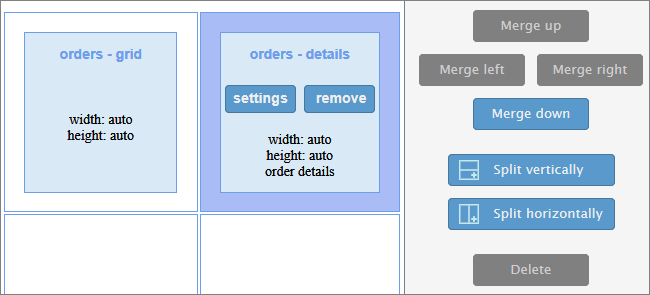
2. Click settings on the grid element and select the grid features to be displayed in a browser (Add/Edit/View/Delete record checkboxes).
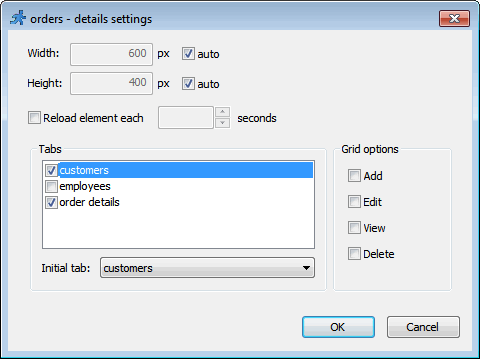
3. If the master table has several details tables, click settings on the details element, select the details tables to display, and set the initial one. Select the grid features to be displayed for the details table (Add/Edit/View/Delete record checkboxes).
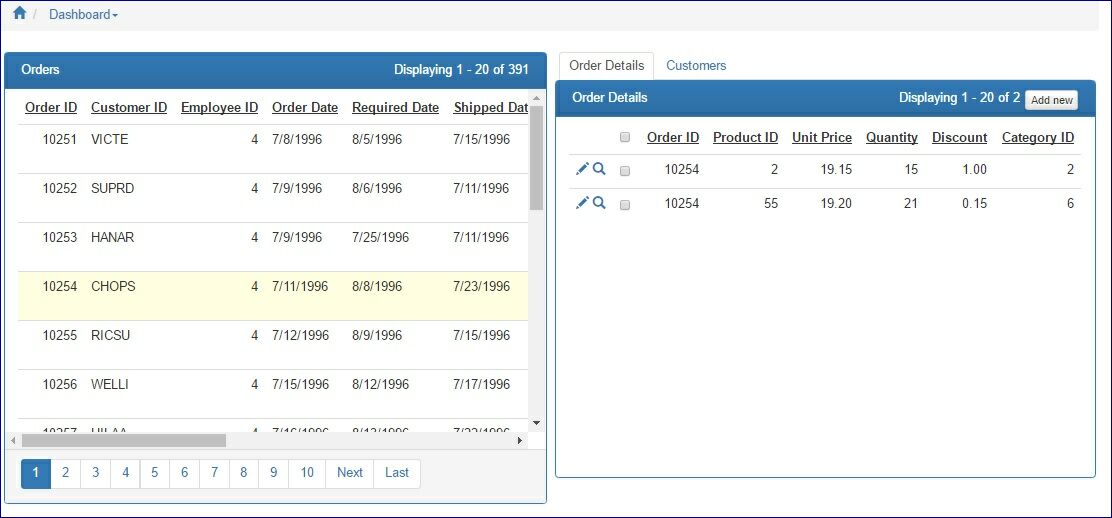
Here is an example of a master-details dashboard; you can see the list of orders and the order/customer details:
Master table and details tables added as data grids
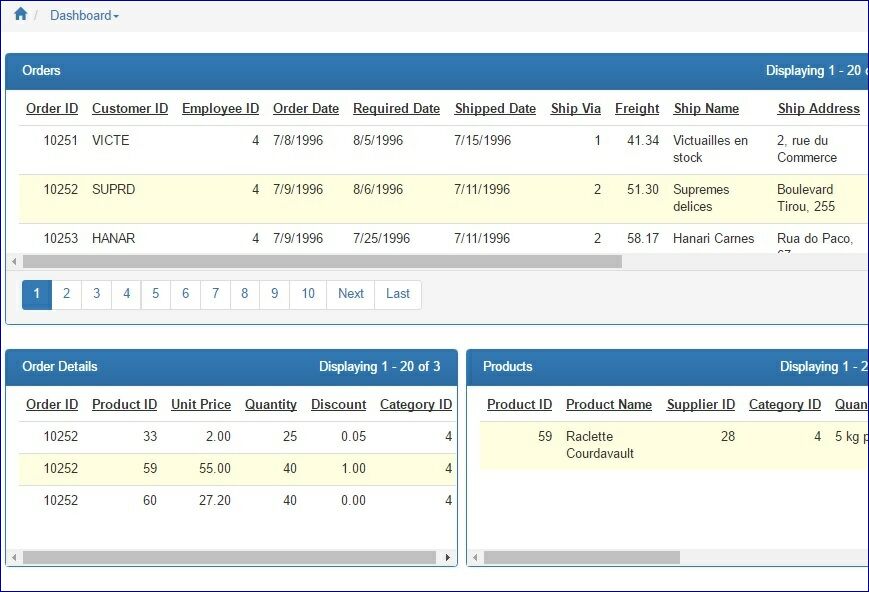
Let's create a dashboard that displays data from nested master-details tables Orders -> Order details -> Products. This dashboard updates the Order details grid upon choosing a specific Order record, and Products grid - upon choosing a specific Order details record.
1. Add the Order (master), Order details and Products (details) tables as data grids.
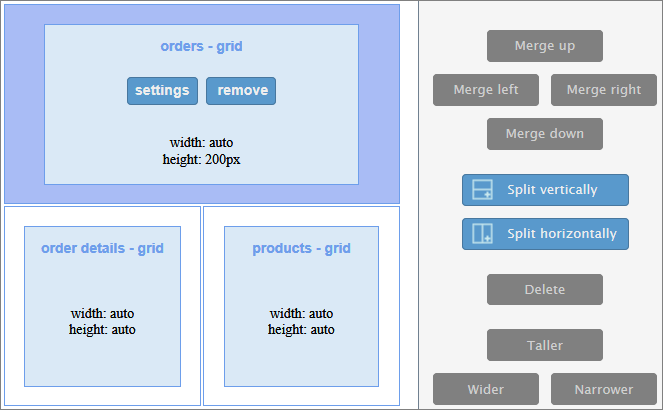
2. Click settings on the Order details grid element and enable the Filter by master table option. Select Orders as the master table.
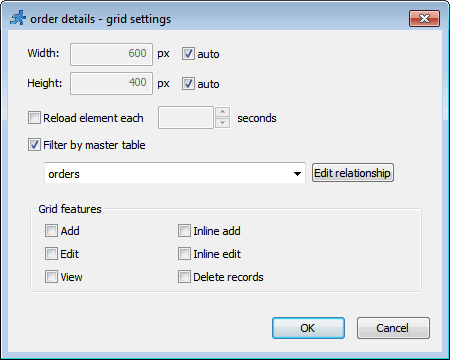
3. Click settings on the Products grid element and enable the Filter by master table option. Select Order details as the master table.
Here is how the dashboard page looks like in the browser:
Master-details relationship between a chart and a data grid
You can apply the same principles when creating the dashboard with a chart as a master and a grid as details.
1. Create a chart as a master and add the details table to it as described in the article Charts and reports as master-details tables.
2. Create a dashboard and add the chart to it.
3. Add the same chart to the dashboard again, but this time choose details in the Choose element to add dialogue.
4. Adjust chart or grid settings, if necessary.
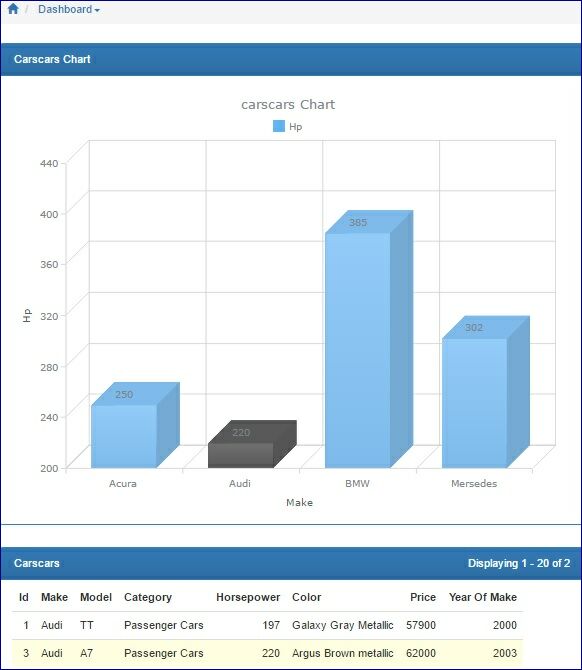
The resulting dashboard page looks like this in the browser. When you click on the chart bar, you filter the details grid.
See also:
•Master-details relationship between tables
•Creating and configuring reports