Description
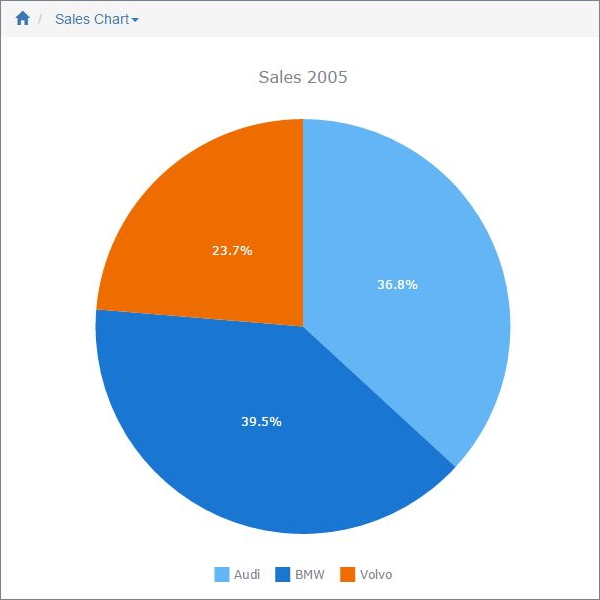
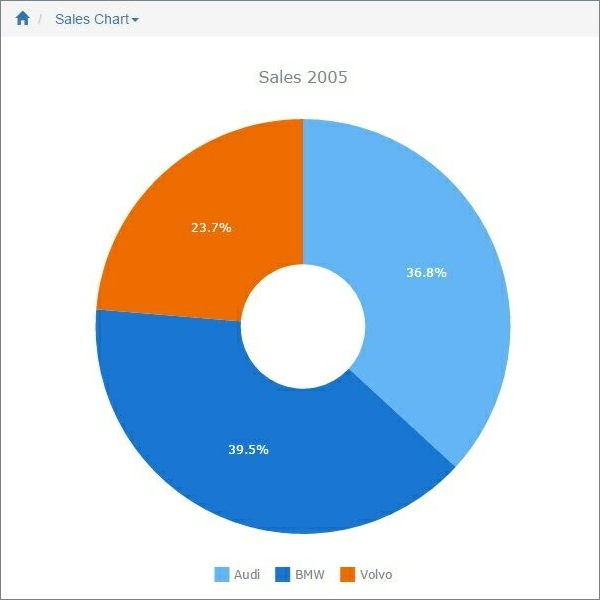
A Pie chart is a circular chart that is divided into sectors, illustrating percentages. A Doughnut chart is identical to the Pie chart, except for having an empty center.
You can create single-series and multi-series Pie/Doughnut charts by choosing one or several Data series fields.
Examples
Sample data table:
Make |
Sales2005 |
Audi |
14000 |
BMW |
15000 |
Volvo |
9000 |
In the examples, we chose Sales2005 as the Data Series field, Make as the Label field.
Pie chart
Doughnut chart
Other chart types:
•Financial OHLC/Candlestick charts
See also:
•Using SQL to shape chart data