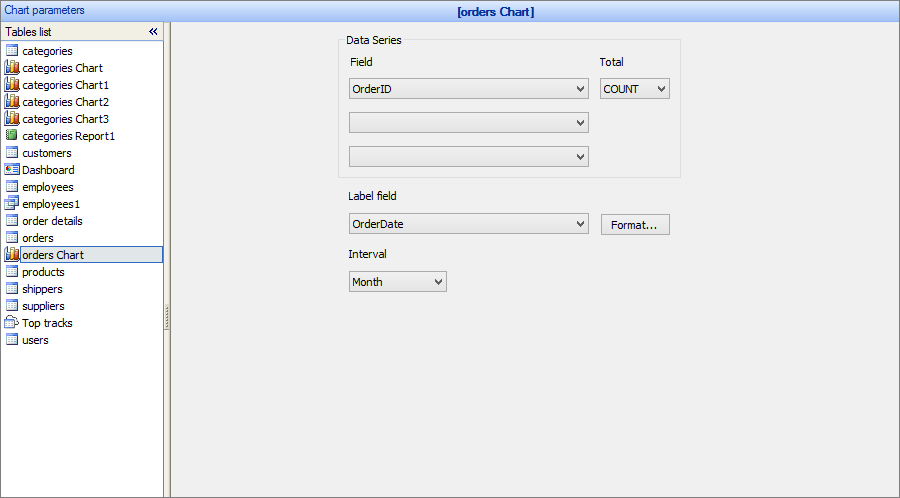
The Chart parameters screen allows you to choose the Data series fields (fields with data) and the Label field (field with data labels).
You can add any number of Data series fields. Additional data series dropdown boxes appear automatically once you've used the available ones.
For more information about choosing the Data series fields for certain chart types, see Chart types.

Total options are: AVG, MIN, MAX, COUNT and SUM. If you select the total data will be grouped by this field automatically. You also get an option to select grouping interval. For date fields it will have options like month, year and day. Numeric fields will have options like 10s, 100s and 1000s. Text fields will have interval options like first letter, first two letters etc.
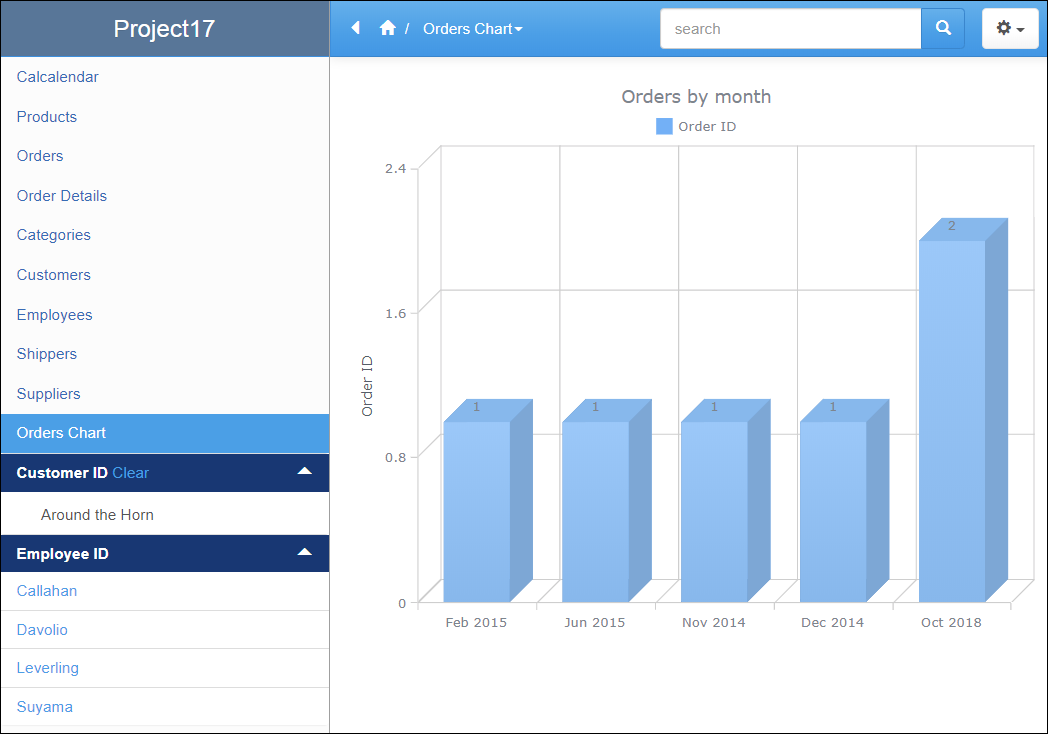
Here is the chart that will be built based on the settings above.

Here is an excellent video that covers grouping in charts.
To further customize the chart appearance like colors, fonts, or the chart title, use the ChartModify event.
See also:
•Using SQL to shape chart data