The Enterprise Edition of ASPRunner.NET includes an online report/chart builder that allows you to view, create, edit, and delete charts and reports in the browser.
To enable the online report/chart builder, select the Web Reports checkbox on the Miscellaneous screen and build the project.
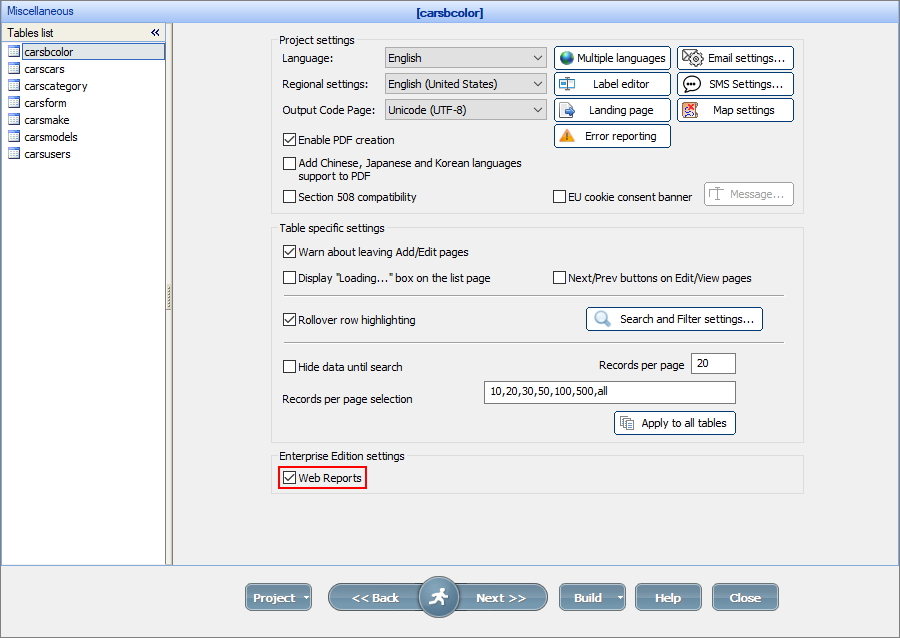
Then launch the online report/chart builder by running webreport. in the browser (e.g., http://www.yourwebsite.com/project1/webreport.).
Note: the online report/chart builder uses the ASPRunner.NET project security model. So if you use a Login page, you need to log into your application first.
Working with the online report/chart builder
The start page presents you with the list of charts and reports. If your project uses permissions, the charts and reports are divided into shared and private ones.
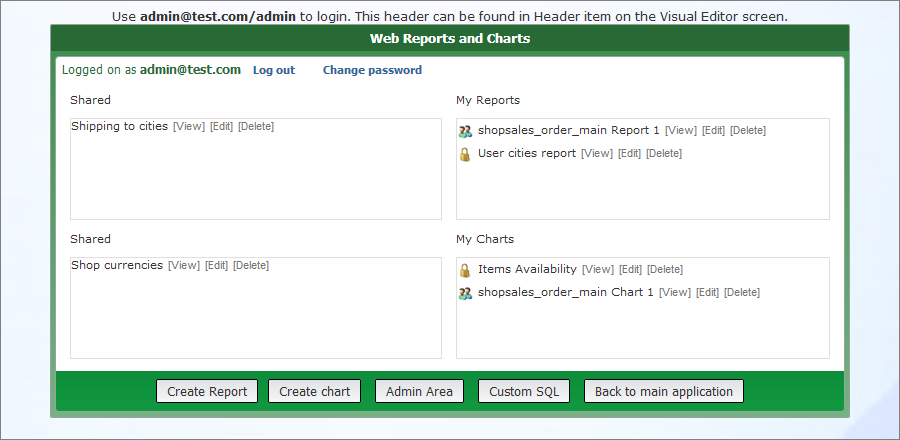
You can view, edit, or delete the charts and reports if the permissions allow you to do so. You can also create a new chart or a new report.
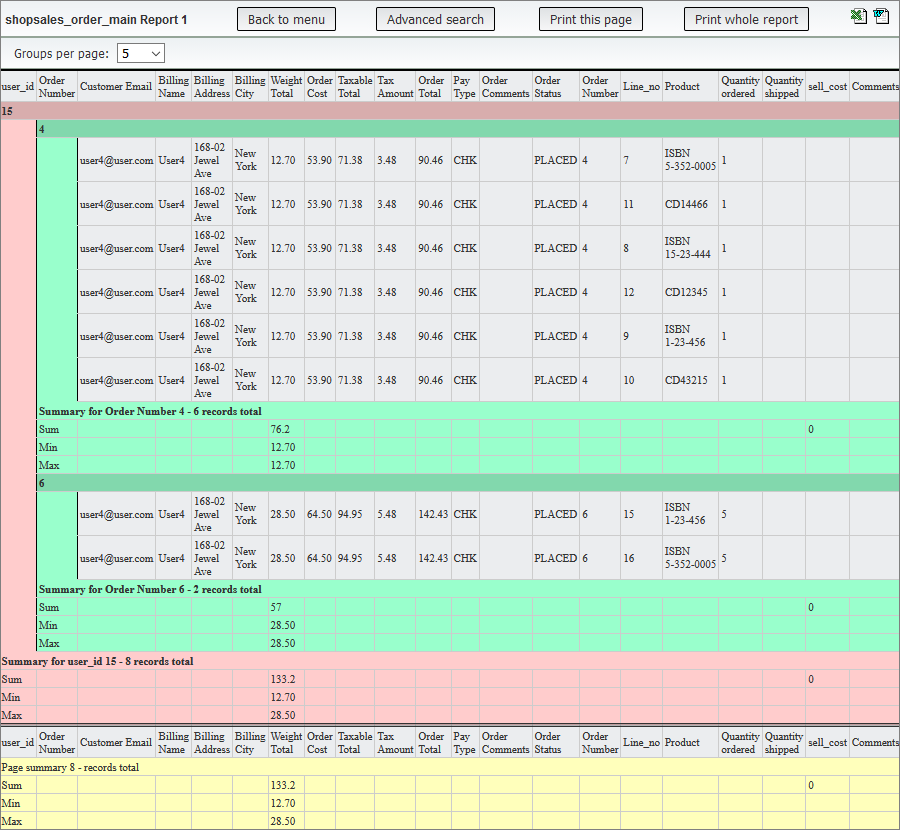
Use Advanced search to narrow down the results while viewing charts and reports. When viewing a report, you can also print the current page or the whole report, open a report as a Microsoft Word or Microsoft Excel document.
Here is an example of a web report:
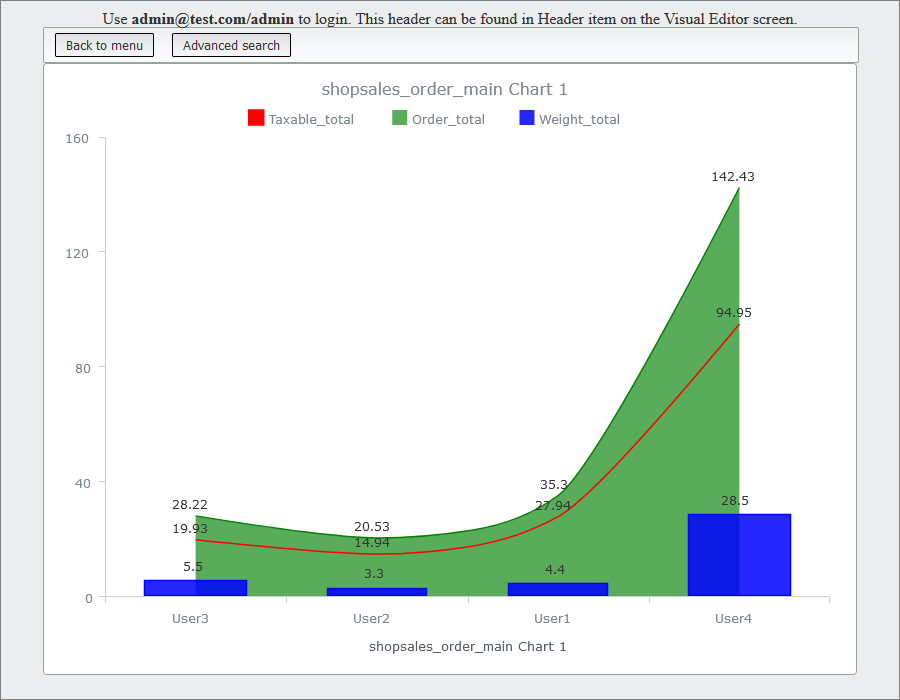
Here is an example of a web chart:
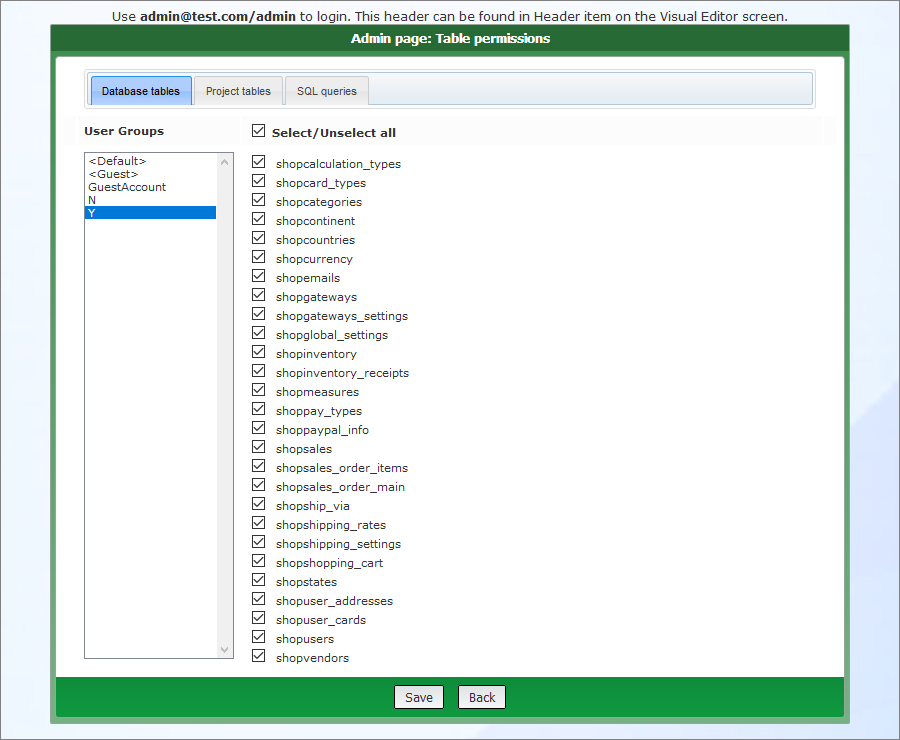
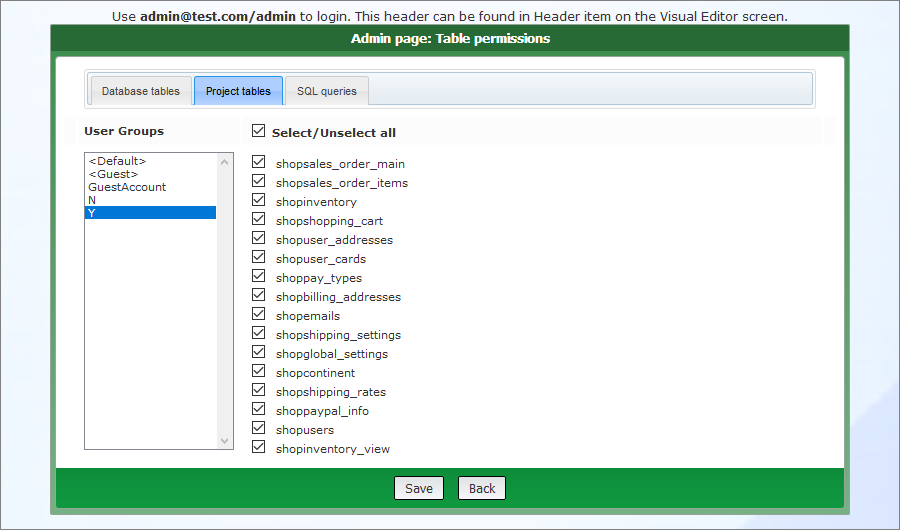
The Admin area allows you to set up the group permissions for creating web reports and charts using the Database tables, Project tables, and SQL queries tabs. You can learn more about these tabs on Creating web reports or Creating web charts articles.
Here is the Database tables permissions tab:
Here is the Project tables permissions tab:
Here is the SQL queries permissions tab:

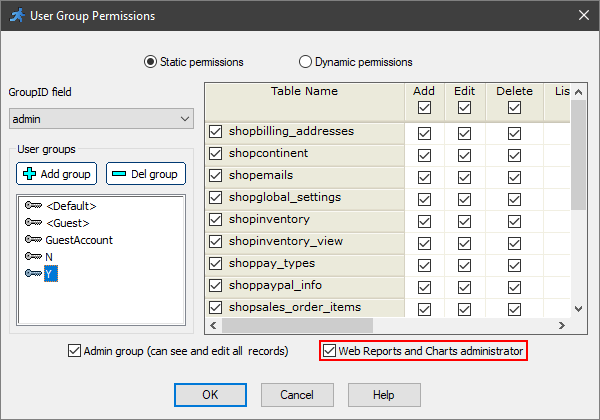
The Admin area is available only for the web reports and charts administrator who can be assigned in the Security -> Permissions popup.
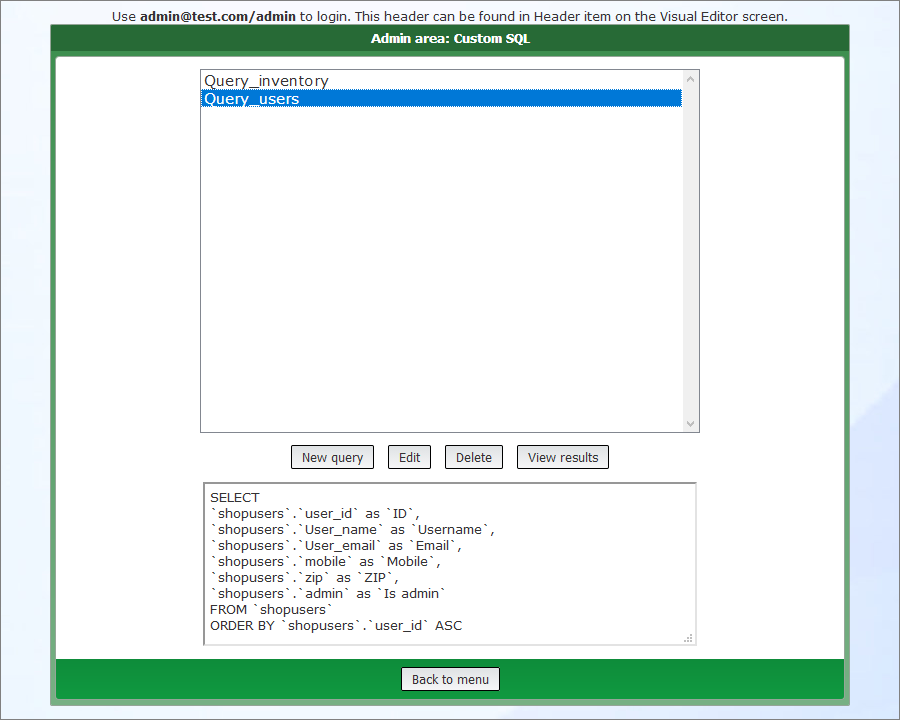
A user with admin permissions (admin) can create, edit, and delete custom SQL queries by clicking the Custom SQL button. These queries can be used by other users as data sources for reports and charts. For more information, see Custom SQL.
See also:
•Creating and configuring reports