Creating a chart
To create a chart:
1. Proceed to the Datasource tables screen and click Create Chart.
2. Select the table and set the chart name. Click OK.
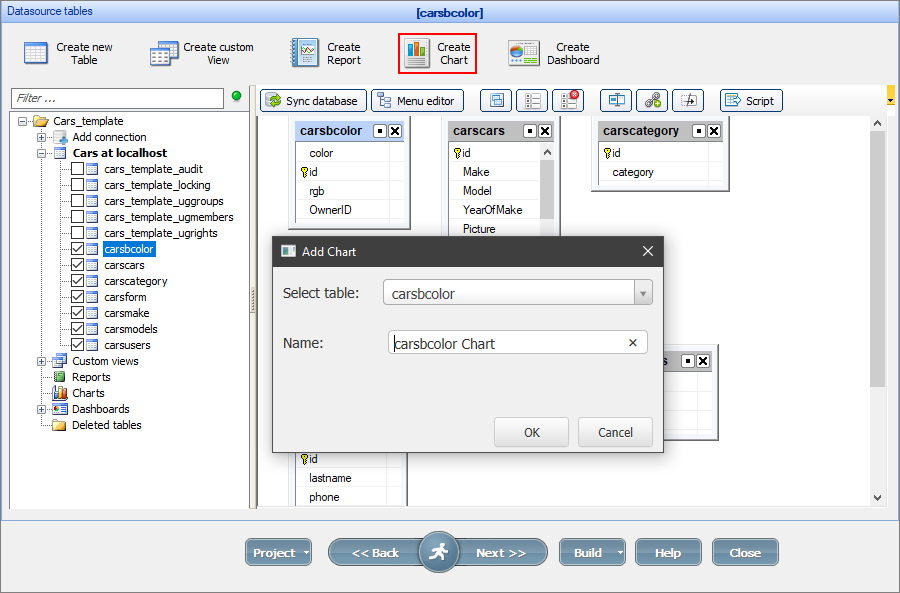
Note: you can create a copy of an existing chart (right-click the chart and select Copy).
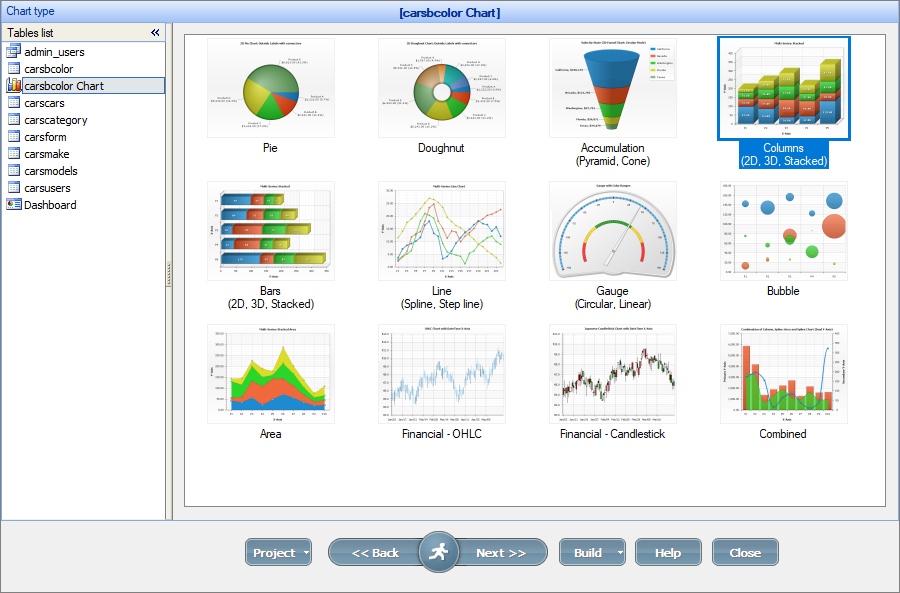
Modifying the chart
On the next several screens (use the Next button to navigate) you can:
•make the changes to the SQL query. More info about editing SQL queries;
•select the type of chart to build. More info about chart types;
•choose the Data Series fields (more info about setting chart parameters);
•modify the chart appearance options.
Note: you can use charts with both master and details tables. For more information, see Master-details relationship between tables.
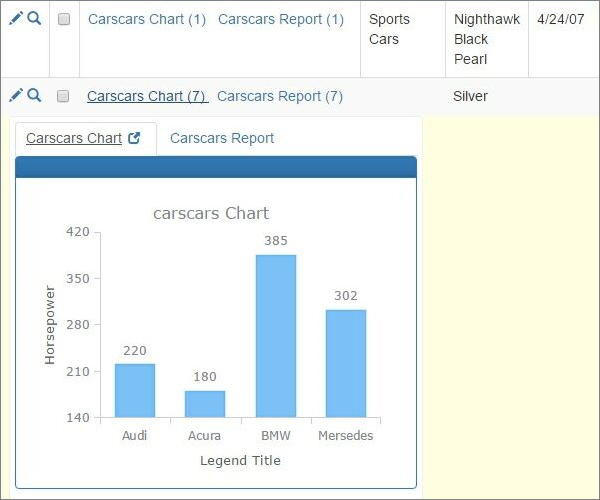
A chart as a details table:
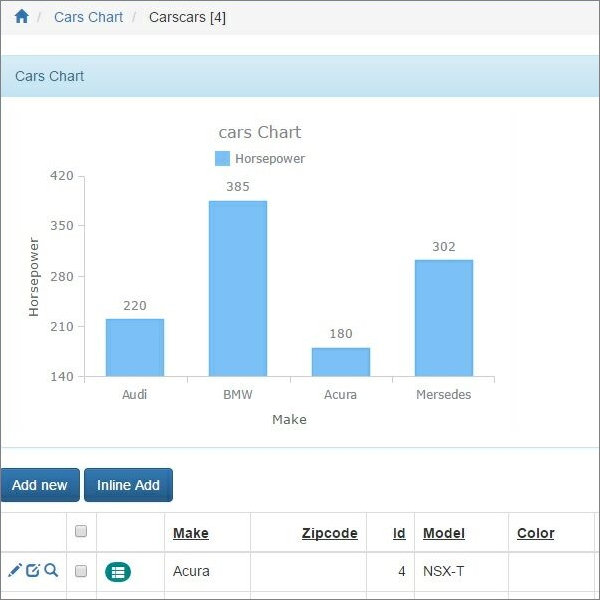
A chart as a master table:
To further customize the chart appearance like colors, fonts, or the chart title, use the ChartModify event.
See also:
•Using SQL to shape chart data
•Building a connected scatter chart