Charts are all about visualizing the numbers or percentages - they require data fields that store numeric values. However, you can use SQL queries to build charts using almost any initial data.
Consider the following Orders table:
Customer |
Country |
Total |
Andrew Peters |
USA |
$250 |
Katie Bradshow |
Australia |
$85 |
Jeff Simpson |
USA |
$150 |
Arnold Matteus |
Germany |
$120 |
Arnold Matteus |
Germany |
$160 |
Jeff Montgomery |
GB |
$150 |
Andrew Peters |
USA |
$65 |
Jeff Simpson |
USA |
$95 |
Luke Sohu |
France |
$40 |
Jeff Montgomery |
GB |
$120 |
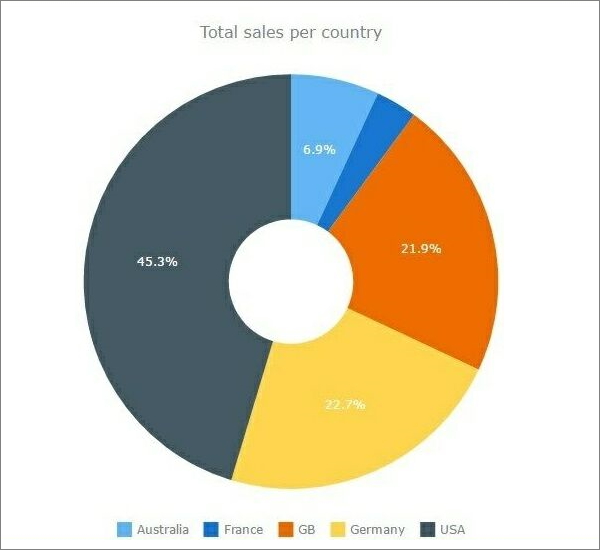
Example 1: Total sales per country
SQL query:
select Country, sum(total) as STotal
from Orders
group by country
order by 2 desc
Results:
Country |
STotal |
USA |
$560 |
Germany |
$280 |
GB |
$270 |
Australia |
$85 |
France |
$40 |
The resulting chart:
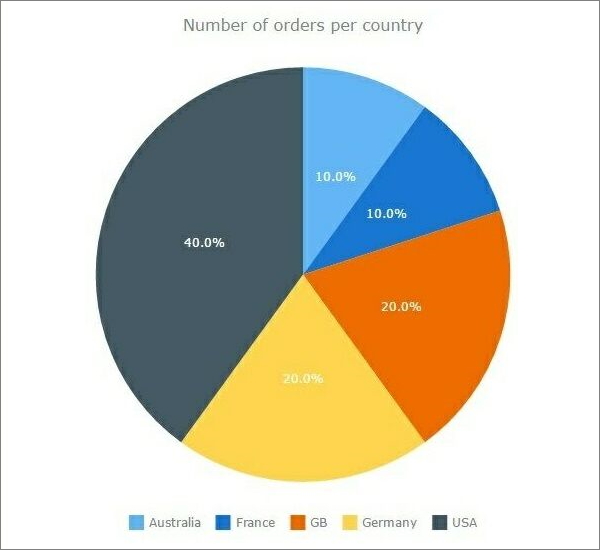
Example 2: Number of orders per country
SQL query:
select Country, count(total) as CTotal
from Orders
group by country
order by 2 desc
Results:
Country |
CTotal |
USA |
4 |
Germany |
2 |
GB |
2 |
Australia |
1 |
France |
1 |
The resulting chart:
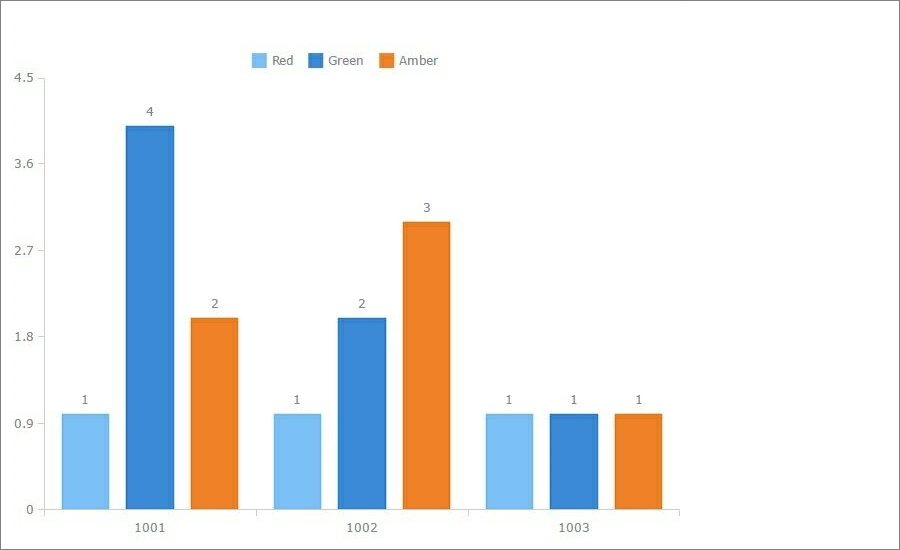
Example 3: Shaping your data in a more complex way
This example shows how to use GROUP BY in conjunction with INNER JOIN. For example, we have the following data and would like to display a diagram illustrating how many flags each client has.
clientid |
flag |
1001 |
Green |
1001 |
Green |
1001 |
Green |
1001 |
Green |
1001 |
Amber |
1001 |
Amber |
1001 |
Red |
1002 |
Green |
1002 |
Amber |
1002 |
Amber |
1002 |
Amber |
1002 |
Red |
1003 |
Green |
1003 |
Amber |
1003 |
Red |
SQL query:
select a.clientid, a.green,b.red, c.amber
from (select count(flag) as green, clientid from sensorstatus
where flag='Green' group by clientid) a
inner join (select count(flag) as red, clientid from sensorstatus
where flag='Red' group by clientid) b on a.clientid=b.clientid
inner join (select count(flag) as amber, clientid from sensorstatus
where flag='Amber' group by clientid) c on a.clientid=c.clientid
Results:
clientid |
green |
red |
amber |
1001 |
4 |
1 |
2 |
1002 |
2 |
1 |
3 |
1003 |
1 |
1 |
1 |
The resulting chart:
See also:
•Building a connected scatter chart