Description
A Column/Bar chart is a chart with rectangular bars. The height/length of the bars is proportional to the magnitudes/frequencies of the data they represent.
The Column chart has vertical bars. With Column charts, the categories are typically organized along the horizontal axis and values - along the vertical axis.
The Bar chart has horizontal bars. With Bar charts, the categories are typically organized along the vertical axis and values - along the horizontal axis.
Consider using a Bar chart when:
•the axis labels are long;
•the values represent durations.
You can create single-series (one Data series field and Label field selected) or multi-series (two or more Data series fields selected) Column/Bar charts.
Chart settings
•Chart 3D - this option allows building a 3D (three-dimensional) chart. With this option disabled, a 2D (two-dimensional) chart is built.
•Chart stacked - this option allows building a stacked chart where a single bar on the chart shows more than one category of data. The stacked chart requires two or more Data series fields selected.
Examples
Sample data table:
Make |
Sales2004 |
Sales2005 |
Audi |
10000 |
14000 |
BMW |
14000 |
15000 |
Volvo |
10000 |
9000 |
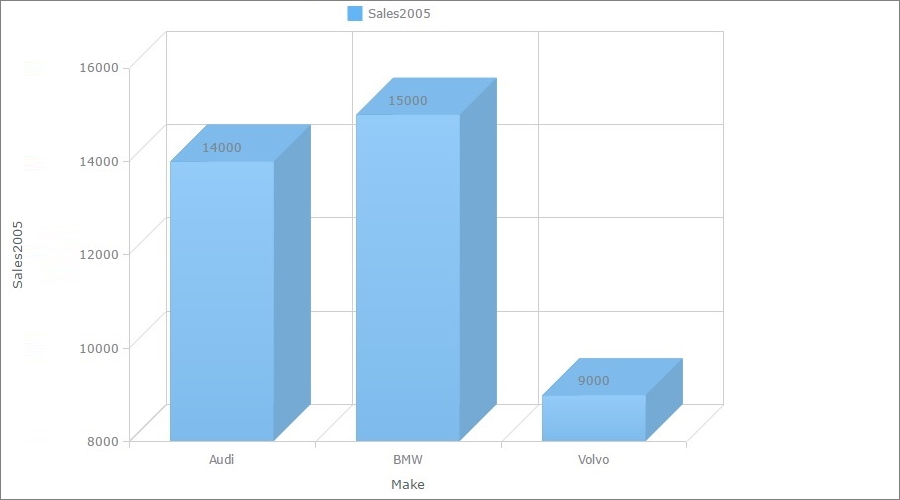
A 3D column chart
In this example, we chose Sales2005 as the Data Series field, Make as the Label field.
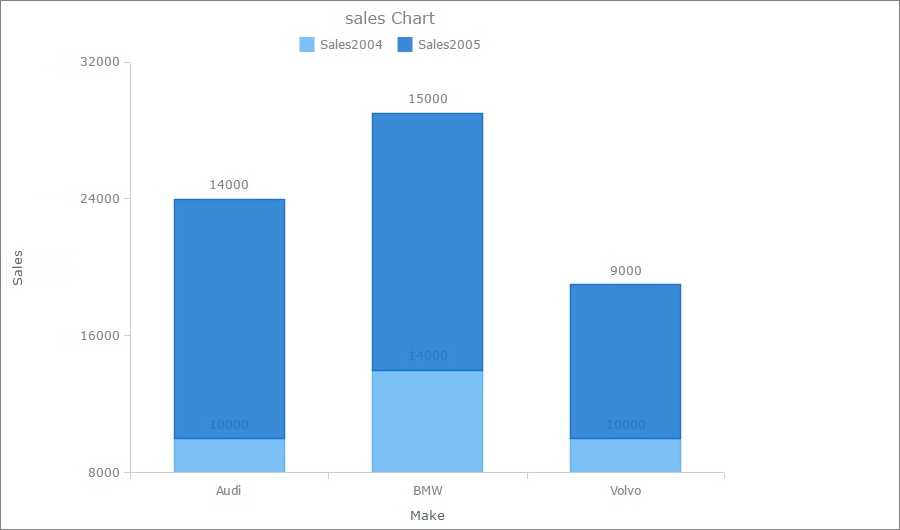
A stacked column chart
In this example, we chose Sales2004 and Sales2005 as the Data Series fields, Make as the Label field.
Other chart types:
•Financial OHLC/Candlestick charts
See also:
•Using SQL to shape chart data