Description
An Area chart is based on the Line chart, but the area between the line and the x-axis is colored. Area charts are used to represent the totals over time using numbers or percentages.
You can build single series or multi-series Area charts.
Chart settings
•Chart stacked - this option allows building stacked chart where a horizontal point on the chart can show several vertical points of data. The Stacked chart requires two or more Data series.
Examples
Sample data table:
Month |
Sales2004 |
Sales2005 |
Jan |
10000 |
14000 |
Feb |
14000 |
15000 |
Mar |
12000 |
9000 |
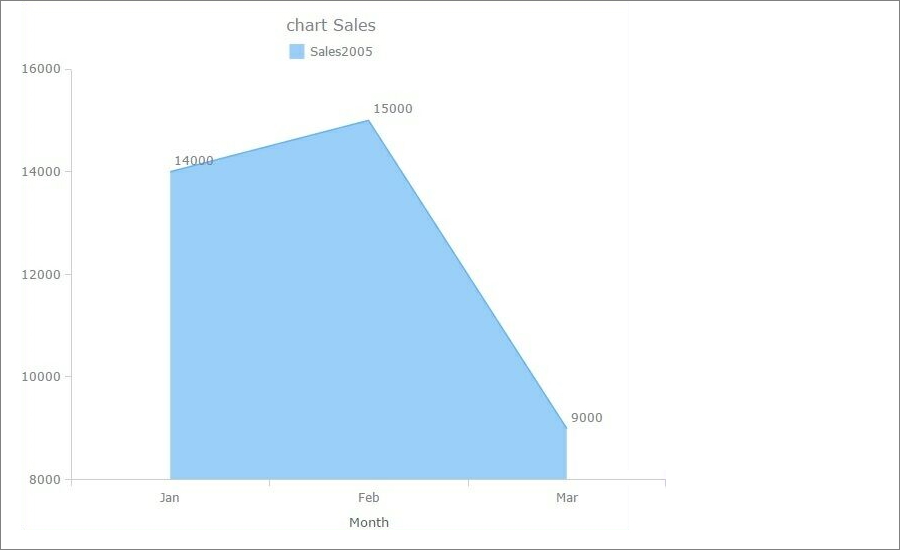
Single series area chart
In this example, we chose Sales2005 as the Data Series field, Month as the Label field.
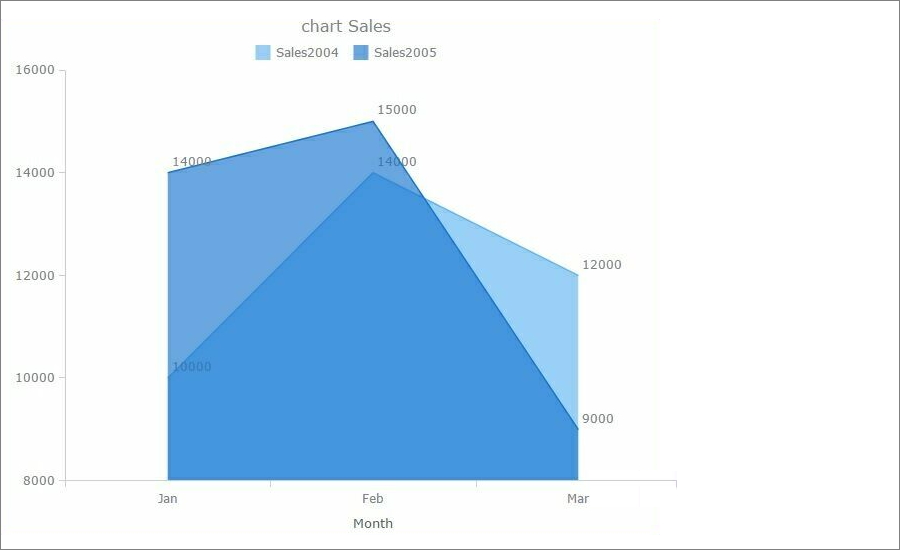
Multi-series area chart
In this example, we chose Sales2004 and Sales2005 as the Data Series fields, Month as the Label field.
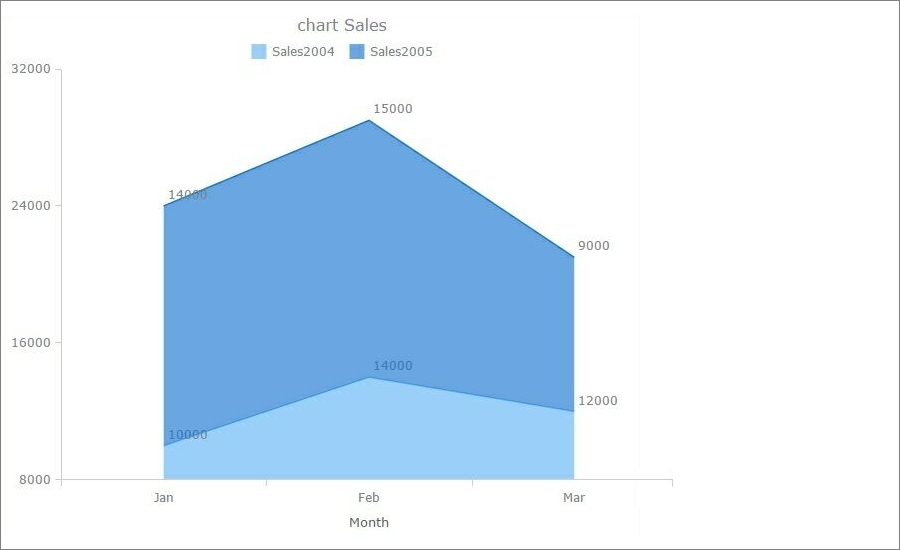
Multi-series stacked area chart
In this example, we chose Sales2004 and Sales2005 as the Data Series fields, Month as the Label field.
Other chart types:
•Financial OHLC/Candlestick charts
See also:
•Using SQL to shape chart data