Description
Accumulation charts are single-series charts that represent data in percentages. This type of charts does not utilize axes. The height of a chart segment is proportional to the y-axis value of the corresponding point.
Chart settings
•Accumulation inverted - enable this option to make the chart image appear inverted.
Example
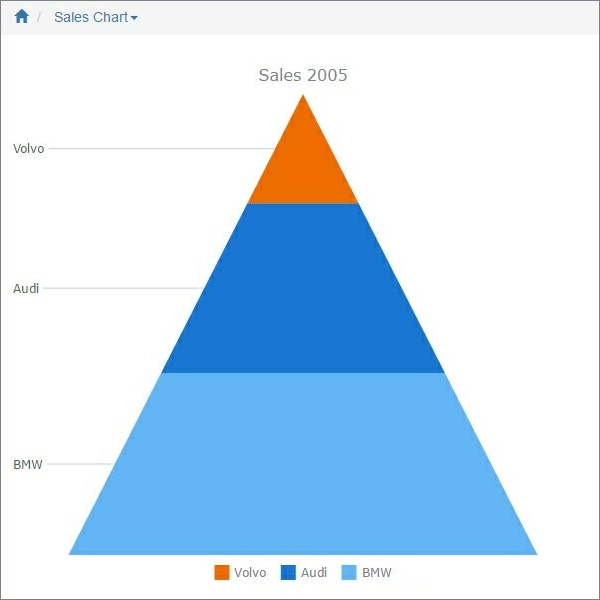
Sample data table:
Make |
Sales2005 |
BMW |
15000 |
Audi |
14000 |
Volvo |
9000 |
In this example, we chose Sales2005 as the Data Series field, Make as the Label field.
Other chart types:
•Financial OHLC/Candlestick charts
See also:
•Using SQL to shape chart data